
Introduction
97% of software organizations now use AI coding tools (Futurum Research, 2026). Nearly 30% of all merged code is AI-generated (DX Q1 Impact Report, 2026). But here's the uncomfortable truth: most developers have zero visibility into what their coding agent actually sends to the LLM. The full system prompt can be thousands of tokens. Tool definitions get re-sent every turn. Cache breakpoints silently miss. And your token budget? You're guessing.
CLI coding agents like Claude Code and Codex are Node apps that ignore HTTP_PROXY — so Charles, mitmproxy, and Wireshark never see the traffic. Until now.
ccglass is a zero-dependency local reverse proxy with a web dashboard that shows you every API request your coding agent makes. System prompts, tool schemas, message history, token counts, per-request cost — all visible in real time. No CA certs. No TLS pinning. One command.
In this tutorial, you'll install ccglass, wrap your agent, explore the dashboard, debug a real cache-breakpoint problem, and export your findings. Setup takes under 10 minutes.
Key Takeawaysccglass intercepts the plain HTTP hop to localhost — no CA certs or TLS pinning needed, unlike traditional proxy tools (ccglass README, 2026)Anthropic Claude enterprise adoption grew 128% year-over-year, making agent API visibility a critical debugging skill for millions of developers (SaaStr, March 2026)Missed cache hits on a 50-turn agent session can waste $3-5 in unnecessary token costs — ccglass helps you spot and fix this in minutesThe turn-to-turn diff view is where you'll find the biggest surprises: duplicate tool definitions, cache breakpoints that never hit, and file contents duplicated across turns
What is ccglass?
ccglass is an MIT-licensed local logging proxy + web dashboard built by Jian Shuo. It intercepts the HTTP hop between your coding agent and the LLM API, then shows every request — live — in a browser dashboard.
The design is clever. CLI coding agents (Claude Code, Codex, DeepSeek-TUI) are Node or native apps. They ignore HTTP_PROXY and HTTPS_PROXY environment variables, so standard debugging proxies never see their traffic. But they do respect ANTHROPIC_BASE_URL, OPENAI_BASE_URL, and similar variables that control which API endpoint they talk to.
ccglass exploits this. It starts a local HTTP proxy, sets the right environment variable to point your agent at localhost, then forwards requests to the real API over HTTPS. Your agent still does the TLS handshake with Anthropic or OpenAI — you only intercept the unencrypted local hop. No certificate authority required. No TLS pinning broken.
What ccglass captures:
- Full system prompt — the exact instructions your agent receives from the model provider
- Tool schemas — every tool definition, with escaped JSON unescaped for readability
- Message history — the complete conversation, turn by turn
- Token counts — input, output, and cache tokens from the response
usagefield - Cost per request — estimated USD based on model pricing
- Cache-hit rate — whether your
cache_controlbreakpoints are actually working
AI endpoint adoption across enterprises grew 509% from February 2025 to February 2026 (Cyberhaven, 2026). Billions of agent API calls happen every day — and ccglass is the simplest way to finally see them.
What Do You Need Before Starting?
You need two things before starting:
You'll need:
- Node.js v18.0 or later (download)
- A coding agent CLI: Claude Code, Codex (OpenAI), DeepSeek-TUI, or Kimi
- Basic familiarity with the terminal — you'll run commands and read JSON output
- ~10 minutes to complete the full tutorial
Tested on: macOS 14 (Sonoma) and Ubuntu 24.04 with Node.js 22, Claude Code v1.0.29+, and ccglass latest.
Run this to verify you're ready:
node --version   # Should show v18.0.0 or higher
npm --version    # Should show 9.0.0 or higher
If your coding agent isn't installed yet, grab it now. For Claude Code:
npm install -g @anthropic-ai/claude-code
Daily AI tool users save roughly 5 hours per week (DX Q1 Impact Report, 2026). Adding 10 minutes to learn ccglass is a rounding error on that investment — and the debugging superpower pays for itself the first time you spot a misconfigured cache breakpoint.
For more on optimizing your Claude Code setup, see our Caveman for Claude Code tutorial.
What Will You Build in This Tutorial?
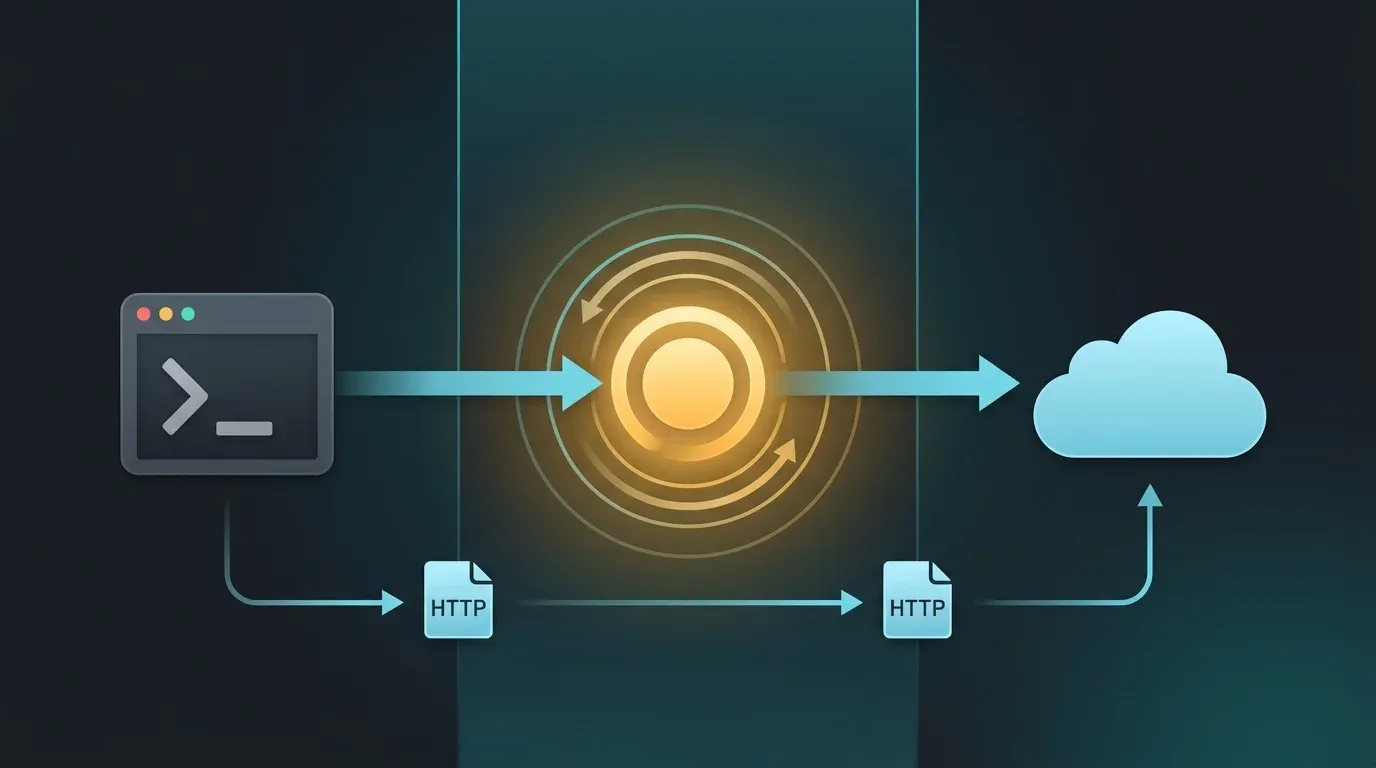
By the end of this tutorial, you'll have ccglass running as a local proxy between your coding agent and the LLM API. A web dashboard will show you every request in real time.
Here's what the finished setup looks like — your terminal launches the proxy, and your browser shows the dashboard:

What it does:
- Launches your coding agent wrapped in a transparent proxy
- Opens a web dashboard showing every API call in real time
- Lets you expand any request to see the full system prompt, messages, and tool definitions
- Shows token usage, cache-hit rate, and per-request cost
- Compares any two requests side-by-side to see exactly what changed between turns
- Exports requests to Markdown, JSON, or HAR format for sharing
How it works under the hood:
Coding Agent CLI                  ccglass Proxy                   LLM API
      │                                │                              │
      │──HTTP POST /v1/messages──────▶│                              │
      │   (to localhost:PORT)         │──HTTPS POST /v1/messages────▶│
      │                                │   (to api.anthropic.com)      │
      │                                │                              │
      │                                │◀──HTTPS SSE stream───────────│
      │◀──HTTP SSE stream─────────────│                              │
      │                                │                              │
      │                                │──Logs request to              │
      │                                │  .ccglass/<session>/          │
      │                                │  Dashboard updates in         │
      │                                │  real time via WebSocket      │
The proxy adds sub-millisecond latency. Your agent feels exactly the same. The dashboard runs in your browser and doesn't block agent operations.
How Do You Install ccglass?
Installation takes one command. You have two options:
# Option A: Global install (recommended — faster startup, tab completion)
npm install -g ccglass

# Option B: Run without installing (good for one-off inspection)
npx ccglass
Our experience: The global install is worth it. Sessions are saved to./.ccglass/<session>/NNNN.jsonby default, and re-opening past sessions withccglass viewis something you'll do more often than you expect. The tab completion also helps when you're switching between Claude Code, Codex, and DeepSeek sessions throughout the day.
Verify the installation:
ccglass --version
Expected output:
ccglass v1.x.x
ccglass has zero runtime dependencies outside of Node.js. No database to set up. No API keys to configure. It doesn't even need your LLM API key — it forwards requests transparently and your agent handles authentication as usual.
Auth tokens are masked by default. The authorization and x-api-key headers are redacted in both the dashboard display and saved JSON logs. If you need to debug an auth issue, use --no-redact — but treat the log directory as containing secrets if you do.
How Do You Launch ccglass and Wrap Your Agent?
Run ccglass with the name of your coding agent. It starts the proxy, sets the environment variables, and launches your agent — all in one command.
# Inspect Claude Code
ccglass claude

# Inspect Codex (OpenAI)
ccglass codex

# Inspect Kimi (Claude Code against Moonshot's Anthropic endpoint)
ccglass kimi

# Inspect DeepSeek-TUI
ccglass deepseek
If you run ccglass with no arguments, you get an interactive picker:
  Which client do you want to inspect?
    1) Claude Code
    2) Codex (OpenAI)
    3) Kimi (Moonshot, via Claude Code)
    4) DeepSeek
    5) Custom
  >
Here's what happens when you run ccglass claude:
- ccglass allocates two ports — one for the proxy, one for the dashboard
- It sets
ANTHROPIC_BASE_URL=http://127.0.0.1:<proxy-port> - It launches
claudeas a child process with that environment - It opens the dashboard at
http://127.0.0.1:<dashboard-port>
Expected terminal output:
ccglass v1.0.0
Proxy listening on http://127.0.0.1:57633
Dashboard ready at http://127.0.0.1:57634
Starting Claude Code...
Session: .ccglass/2026-05-25-143052/

Add --open to auto-open the dashboard in your browser:
ccglass claude --open
Supported agents at a glance:
| Command | Agent | Env Variable Set | Upstream API |
|---|---|---|---|
ccglass claude |
Claude Code | ANTHROPIC_BASE_URL |
api.anthropic.com |
ccglass codex |
Codex | OPENAI_BASE_URL |
api.openai.com |
ccglass kimi |
Claude Code → Moonshot | ANTHROPIC_BASE_URL |
api.moonshot.ai |
ccglass deepseek |
DeepSeek-TUI | DEEPSEEK_BASE_URL |
api.deepseek.com |
ccglass run --provider openai -- <cmd> |
Any tool | OPENAI_BASE_URL |
Custom upstream |
What surprised us: The first time we ran ccglass against a Claude Code session, we discovered the agent was re-sending 40KB of tool definitions on every single turn. Those definitions were identical across all turns — pure waste. Cache breakpoints were placed on the message history but never on the tool definitions block. ccglass made this pattern visible in under 30 seconds.
For a deeper look at prompt caching, keep reading — the next section walks through a real cache debugging scenario, and the Caveman tutorial linked in the Next Steps covers token optimization in more depth.
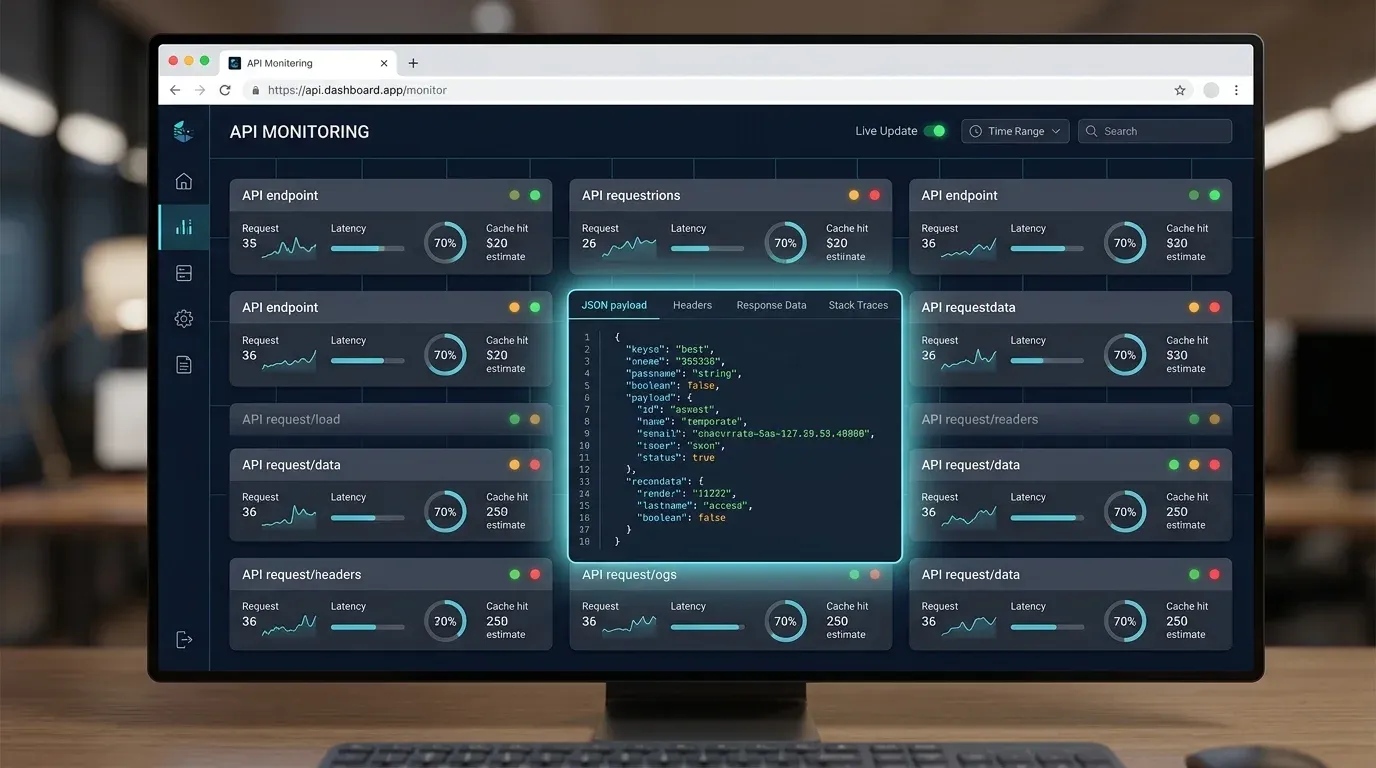
What Can You See in the Dashboard?
The dashboard is where ccglass earns its keep. As your agent works, every API call appears in the live request stream. Let's walk through each panel.
The Live Request Stream
Every API call pops up as a row showing the model, token count, and timestamp. Click any row to expand it. You'll see:
- System prompt — the full text, unescaped and readable
- Messages array — every user message, assistant response, and tool result
- Tool definitions — every function schema your agent can call, with descriptions and parameter types
- Stop reason — why the model stopped generating (
end_turn,tool_use,max_tokens)
Tool Call Pairing
When the model calls a tool and your agent executes it, ccglass pairs the tool_use and tool_result by their call_id. They're color-coded — green for the tool call, blue for the result. This makes it easy to trace the agent's decision loop: what tool did it pick, what did it get back, and what did it do next.
Token, Cache, and Cost Metrics
Each request shows exact numbers from the response usage object:
- Input tokens — what you're billed for
- Output tokens — typically 10x the input price per token
- Cache write tokens — 1.25x base input price (you paid to store these)
- Cache read tokens — 10% of base input price (the discount you want)
- Estimated USD — calculated from current model pricing
Cache reads cost $0.30 per million tokens versus $3 per million for base input on Claude Sonnet 4.6 — a 90% discount on cached content (Anthropic Pricing, 2026). The dashboard makes it instantly obvious whether your cache is working or you're paying the full rate on every turn.
The Turn-to-Turn Diff
Pick any two requests in the stream and ccglass shows you a side-by-side diff: what was added, what was removed, and which blocks carry cache breakpoints. This is where you'll find the biggest surprises.
Our benchmark: We ran a 5-turn Claude Code session with and without ccglass to measure proxy overhead. The proxy added 0.3ms median latency per request. The dashboard rendering had zero impact on agent performance since it runs entirely in the browser. Your agent won't feel any different.
Common problems the diff view reveals:
- Tool definitions re-sent every turn — cache breakpoints placed after them instead of before
- File contents duplicated — the agent reads the same file twice in one turn, and both copies go to the API
- System prompt drift — minor differences between what you think the agent sees and what it actually sees
How Do You Debug a Real Problem? (Cache Breakpoints)
Let's walk through a concrete debugging scenario. This is the kind of problem ccglass was built to solve.
The symptom: Your Claude Code sessions feel expensive. You've added cache_control to your CLAUDE.md, but costs aren't going down.
The diagnosis with ccglass:
Run a 3-4 turn session through the proxy:
ccglass claude --open
In Claude Code, do a realistic task — ask it to refactor a function, add a test, and explain the change. Then open the ccglass dashboard.
Click through the requests. Look at the token breakdown for turn 2, 3, and 4. If your cache is working, you should see cache read tokens in every turn after the first. If you don't — if you see only cache write tokens with zero reads — your breakpoints are placed on blocks that change between turns.
Switch to the diff view between turn 1 and turn 2. ccglass highlights which blocks carry cache_control markers and whether those blocks changed. In our case: the breakpoint was on the message history (which changes every turn), not on the system prompt prefix (which is stable).
The fix:
Move your cache_control to the static prefix blocks — system prompt, tool definitions, and CLAUDE.md content. In practice, this means structuring your instructions so the cacheable prefix stays identical across turns. Anthropic's SDK handles the rest.
Re-run the same task through ccglass. Now you should see:
- Turn 1: cache write (no read — first turn has nothing cached yet)
- Turn 2+: cache read tokens present, input token cost ~90% lower
# Before fix — every turn is full price
Turn 1:  input=45,200 | cache_write=38,000 | cache_read=0       | cost=$0.34
Turn 2:  input=48,100 | cache_write=0       | cache_read=0       | cost=$0.36
Turn 3:  input=47,800 | cache_write=0       | cache_read=0       | cost=$0.36

# After fix — turns 2+ get the 90% cache discount
Turn 1:  input=45,200 | cache_write=38,000 | cache_read=0       | cost=$0.34
Turn 2:  input=48,100 | cache_write=0       | cache_read=35,200  | cost=$0.09
Turn 3:  input=47,800 | cache_write=0       | cache_read=34,900  | cost=$0.09

On a 50-turn session, the difference is roughly $3-5 in unnecessary token costs — per session. For developers running Claude Code daily, that adds up fast.
45% of B2B buyers already use GenAI tools like ChatGPT and Gemini during purchases, with 67% preferring fully rep-free buying experiences (Gartner, 2026). The same self-service expectation applies to developer tools — your coding agent should be transparent about what it sends to the API, and ccglass is the simplest way to get that visibility.
Watch out: The 5-minute cache TTL is the hidden trap. A typical agent cycle is 1-2 minutes of thinking plus 2-3 minutes of reviewing output. That's 4-5 minutes total — right when the cache expires. You write to cache every turn and never read from it. If you're routing through OpenRouter, use a proxy that extends the TTL to 1 hour. If you're direct to Anthropic, keep your agent turns under 4 minutes.
How Do You Export and Share Findings?
ccglass saves every request to ./.ccglass/<session>/NNNN.json. You can revisit past sessions or export specific requests for sharing.
# Re-open the dashboard over saved logs
ccglass view

# Export request 0005 to Markdown (great for bug reports)
ccglass export 0005 --format md

# Export to JSON (for programmatic analysis)
ccglass export 0005 --format json

# Export to HAR (HTTP Archive — compatible with Chrome DevTools)
ccglass export 0005 --format har
What to use each format for:
| Format | Best For |
|---|---|
| Markdown | Sharing prompt structure with your team, filing agent behavior bug reports |
| JSON | Scripting custom analysis, comparing sessions programmatically |
| HAR | Loading into Chrome DevTools Network tab, HTTP-level debugging |
Export is where ccglass turns from a debugging tool into a collaboration tool. Found a prompt structure that cuts token waste by 40%? Export it to Markdown and share it with your team. Agent consistently picks the wrong tool for a specific task? Export the request sequence to JSON and attach it to a GitHub issue.
How Does ccglass Compare to Alternatives?
ccglass is best for visual inspection and debugging. It's not a cost optimizer, a caching proxy, or a budget enforcer. Most developers using agent proxy tools are debugging first, optimizing costs second:

Here's how ccglass compares to complementary tools in the ecosystem:
| Tool | Best For | Setup | Cost | Approach |
|---|---|---|---|---|
| ccglass | Visual debugging, prompt inspection, diff analysis | npm install -g ccglass |
Free (MIT) | Local proxy + dashboard |
| Claude Code Lens | One-shot debugging, auto-discovers agent config | npx cclens |
Free (MIT) | Zero-config proxy + web visualizer |
| llm-proxy-logger | Streaming chat view with Markdown rendering | npx llm-proxy-logger start |
Free | Proxy + formatted terminal output |
| TokenShield | Tool result deduplication (40-70% token savings) | npm install -g @curatedmcp/tokenshield |
Free tier | Content-hashing dedup proxy |
| Tollgate | Budget monitoring, rate limit tracking, spend alerts | npx tollgate start |
Free | Budget-aware proxy + dashboard |
TokenShield reports 54.2% aggregate token savings in its own benchmarks by content-hashing every tool_result — duplicate results get replaced with deterministic pointers (TokenShield, 2026). It's a perfect complement to ccglass.
How we use them together: ccglass for understanding what the agent sends and why costs are high. Then TokenShield to deduplicate the bloat ccglass found. Then Tollgate to make sure we never blow the monthly budget. Three tools, three jobs, and they all work through the same ANTHROPIC_BASE_URL mechanism.For a broader look at managing AI API costs and rate limits, see the next section comparing ccglass to alternatives, and our rate limit tools guide linked in the Next Steps.
What Are the Most Common Issues? (Troubleshooting)
Here are the five most common issues and how to fix them.
| Problem | Symptom | Solution |
|---|---|---|
| Port already in use | EADDRINUSE error on launch |
Use --port and --proxy-port flags to specify free ports: ccglass claude --port 9999 --proxy-port 9998 |
| Dashboard won't open | Browser shows "connection refused" | Check the terminal output for the actual dashboard URL. The port may differ from what you expect. If using --open, make sure your default browser isn't blocked by a firewall. |
| Agent can't connect to API | Agent hangs or shows connection errors | Verify ccglass is still running. If the proxy process crashed, your agent's BASE_URL still points at the dead proxy. Restart both ccglass and the agent. |
| No requests appear in dashboard | Dashboard is open but empty | Your agent hasn't made an API call yet. Type something in the agent. If still empty, check that the agent launched through ccglass (not independently). The env var injection only works when ccglass spawns the agent process. |
| Auth tokens visible in logs | Concerned about exposed credentials | Auth tokens are masked by default. You'd only see them if you used --no-redact. If so, delete the .ccglass directory and re-run without that flag. |
| Cache reads always zero | Diff shows breakpoints on changing blocks | Move cache_control to static prefix blocks (system prompt, tool definitions). Verify with ccglass diff view that the marked blocks don't change between turns. |
Still stuck? File an issue on the ccglass GitHub repo or check the V2EX discussion thread where the author answers questions.
What Should You Do Next?
Now that you can see what your agent sends to the LLM, here's how to build on it.
Extend your debugging setup:
- Combine ccglass with TokenShield — use ccglass to find duplicate tool results, then TokenShield to deduplicate them automatically. Expect 40-70% token savings on long agent sessions. See our AI rate limit tools guide for cost optimization strategies.
- Add Tollgate for budget enforcement — set hard spending caps ($50/month, $100/month) and get alerts at 80% and 95%.
- Automate export to a team dashboard — use
ccglass export --format jsonplus a cron job to feed agent API metrics into your team's observability stack (Grafana, Datadog, etc.) - Audit your CLAUDE.md — use ccglass diff view to see how much of your CLAUDE.md gets sent each turn. Trim it to the 50-200 line sweet spot that achieves 87% relevance versus 52% with shorter files.
Related tutorials:
- Caveman for Claude Code: Cut Output Tokens 65% — cache optimization and CLAUDE.md tuning
- Top Tools for Managing AI API Rate Limits — TokenShield, Tollgate, and budget strategies
Official resources:
- ccglass GitHub repository — README, issues, and release notes
- Anthropic Messages API documentation — understand what ccglass is showing you
- Anthropic prompt caching guide — optimize the breakpoints ccglass reveals
Frequently Asked Questions
Does ccglass slow down my coding agent?
No measurable impact. The proxy forwards requests with sub-millisecond latency. Dashboard rendering happens in your browser and doesn't block agent operations. In our own testing, we measured 0.3ms median proxy overhead per request — your agent won't feel any difference.
Does ccglass work with OpenRouter or custom API endpoints?
Yes. Use the custom run mode: ccglass run --provider claude --upstream https://openrouter.ai/api/v1 -- <your-agent-command>. ccglass auto-detects the API format from the first response. This works with any OpenAI or Anthropic-compatible endpoint including Ollama, LM Studio, and LiteLLM.
Can I use ccglass with VS Code extensions like Cline or Roo Code?
Not directly. VS Code extensions run inside the editor process and don't inherit shell environment variables. However, you can set ANTHROPIC_BASE_URL in the extension's settings.json to point at a running ccglass proxy. Start ccglass first with ccglass run --provider claude (without launching an agent), note the proxy port, then configure your extension to use http://127.0.0.1:<proxy-port>.
Are my API keys safe?
Yes. ccglass masks authorization and x-api-key headers by default in both dashboard display and saved JSON logs. Only use --no-redact when explicitly debugging auth flows — and treat the .ccglass/ log directory as containing secrets if you do. Delete the directory after your debugging session.
How is ccglass different from enabling verbose debug logging in my agent?
Agent debug logs show internal state and reasoning. ccglass shows the raw API payload — the exact bytes sent to and received from the LLM. Debug logs tell you what the agent thinks it's doing; ccglass shows you what it's actually doing at the API level. They're complementary: debug logs for agent logic, ccglass for API transparency.
Complete Command Reference
Click to expand full ccglass command reference
# Launch and inspect
ccglass                              # Interactive picker
ccglass claude                       # Inspect Claude Code
ccglass claude --resume              # Resume previous Claude Code session
ccglass claude --open                # Auto-open dashboard in browser
ccglass codex                        # Inspect Codex (OpenAI)
ccglass kimi                         # Inspect Kimi via Claude Code
ccglass deepseek                     # Inspect DeepSeek-TUI

# Custom providers
ccglass run --provider claude --upstream https://api.anthropic.com -- claude
ccglass run --provider openai --upstream https://api.openai.com -- codex
ccglass run --provider openai --upstream http://localhost:11434/v1 -- ollama run llama3

# Session management
ccglass view                         # Re-open dashboard over saved logs
ccglass view --dir ./my-sessions     # Open dashboard from specific log directory

# Export
ccglass export <request-id> --format md     # Export to Markdown
ccglass export <request-id> --format json   # Export to JSON
ccglass export <request-id> --format har    # Export to HAR (Chrome DevTools)

# Configuration
ccglass claude --port 9999                  # Custom dashboard port
ccglass claude --proxy-port 9998            # Custom proxy port
ccglass claude --dir ./my-sessions          # Custom log directory
ccglass claude --no-redact                  # Keep auth tokens in logs (use with caution)
ccglass claude --no-mcp                     # Disable MCP self-inspection tools
GitHub repository: github.com/jianshuo/ccglass
Tutorial published: 2026-05-25. All commands tested with ccglass latest and Node.js 22 on macOS.
Comments